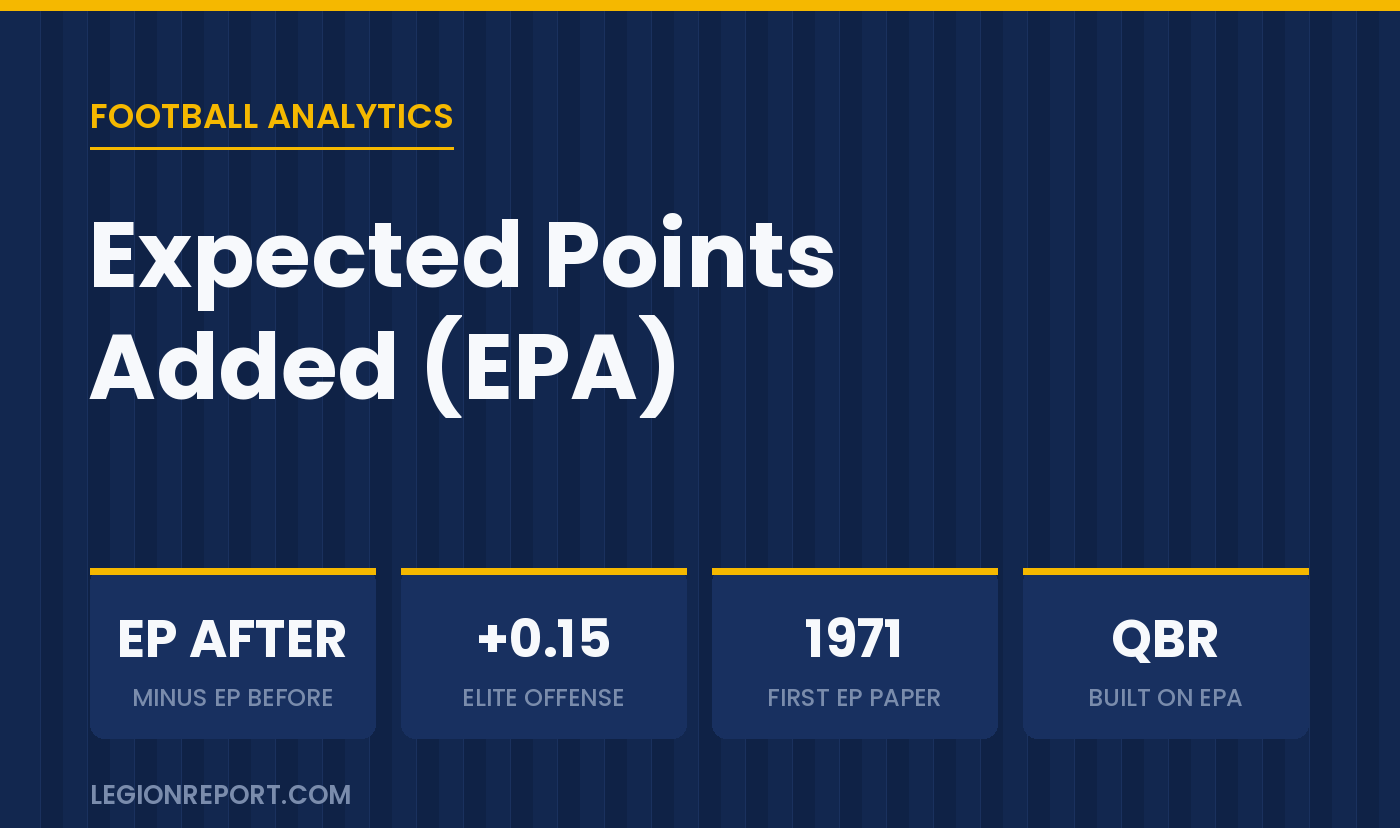
Expected Points Added — EPA — is the foundation of modern football analytics, the stat underneath QBR, win probability models, fourth-down decision charts, and half the numbers you hear on broadcasts. The idea is simple: every down, distance, and field position combination is worth some number of expected points, based on decades of play-by-play history. First-and-10 at your own 25 is worth about half a point; first-and-goal at the 2 is worth nearly six. EPA measures how much each play moves that number.
A 15-yard completion on third-and-12 has a large positive EPA — it converted a likely punt into a fresh set of downs. A 3-yard gain on third-and-7 has negative EPA even though it “gained yards,” because it turned a live drive into a punt. That’s the stat’s power: it prices every play by its effect on scoring, not by raw yardage, which is why a team can out-gain its opponent and lose the EPA battle badly.
The chart below covers how expected points work, how EPA is calculated and read, and the benchmarks that matter. Take a look, then we’ll get into the limitations.
FOOTBALL ANALYTICS
Expected Points Added (EPA), Explained
The value of every play, measured in points
BASIS
Field state
Down, distance, position
ELITE OFF.
+0.15/play
Season-level
POWERS
QBR & 4th-down math
And team rankings
How expected points work
The state values behind the stat
| Concept | Detail |
|---|
| Expected points (EP) | The average net points the possessing team will score next from a given down-distance-field position state, estimated from historical play-by-play |
| EPA of a play | EP after the play minus EP before it (turnovers flip possession, so EP swings can exceed 6 points… a pick-six can be worth about -10 EPA) |
| Example: gain | 1st-and-10 at own 25 (EP ~0.6) to 1st-and-10 at own 40 (EP ~1.6) = +1.0 EPA |
| Example: ‘good’ run that isn’t | 3-yard gain on 3rd-and-7 leaves 4th-and-4: EP drops as a punt looms = negative EPA despite positive yards |
| Scoring plays | A touchdown from the 30 adds the gap between pre-play EP and ~7; field goals credit ~3 minus the prior EP |
| Aggregation | Sum or average per play across a game, season, player, or unit — EPA/play is the standard efficiency measure |
Reading EPA per play
Benchmarks
| EPA per play (offense) | What it means over a season |
|---|
| +0.15 and above | Elite offense — typically the league’s top 2-3 units |
| +0.05 to +0.15 | Good to very good |
| -0.05 to +0.05 | Around league average |
| Below -0.05 | Struggling offense |
| QB EPA/play +0.20+ | MVP-level quarterback season |
| Defense | Same scale, inverted — negative EPA allowed per play is good defense |
Where EPA shows up
The stat behind the stats
| Where you see EPA | How it’s used |
|---|
| Fourth-down decisions | Go/kick charts compare the EP of going for it vs. punting or kicking — the math behind the analytics-era aggression |
| QBR | ESPN’s QBR is EPA divided among players and adjusted for situation |
| Team rankings | EPA/play offense and defense predict future wins better than yards or points |
| Play calling | Pass plays average meaningfully higher EPA than runs, which drove the league’s early-down passing shift |
| Win probability | WP models are EP’s sibling — same state-based logic applied to winning instead of scoring |
EPA FACTS
Born in 1971
Virgil Carter — an NFL quarterback with an engineering degree — co-authored the first expected points paper; Romer’s 2006 fourth-down study and public play-by-play data made it mainstream.
Yards lie, EPA doesn’t
Teams routinely win the yardage battle and lose the EPA battle — turnovers and failed third downs are priced correctly by EPA and ignored by total yards.
Garbage time is the caveat
Raw EPA counts a meaningless late touchdown at full value; analysts filter by win probability or use situation-weighted versions for cleaner reads.
How EPA works and why it’s the foundation of football analytics.
What EPA Doesn’t Tell You
EPA is a results stat: it prices what happened, not who deserved credit. A perfectly thrown ball that’s dropped is negative EPA on the quarterback’s ledger; a screen taken 70 yards is a huge positive he barely influenced. It’s also context-blind in the raw form — garbage-time production counts, opponent strength doesn’t — which is why serious models layer adjustments (opponent, situation, win probability filters) on top. And at the play level it’s noisy: one play’s EPA means little, a season’s EPA per play means a lot. Treat it like a scale, not a microscope.
The Bottom Line
EPA converts every play into points by measuring how much it changed the expected score, which makes it the best single currency for comparing plays, players, and teams. Elite offenses live above +0.15 EPA per play, the stat powers everything from QBR to fourth-down charts, and its main caveats — credit assignment and garbage time — are manageable with context. For the accuracy stat it pairs with, see our guide to CPOE, and for the consistency measure that complements both, success rate.