
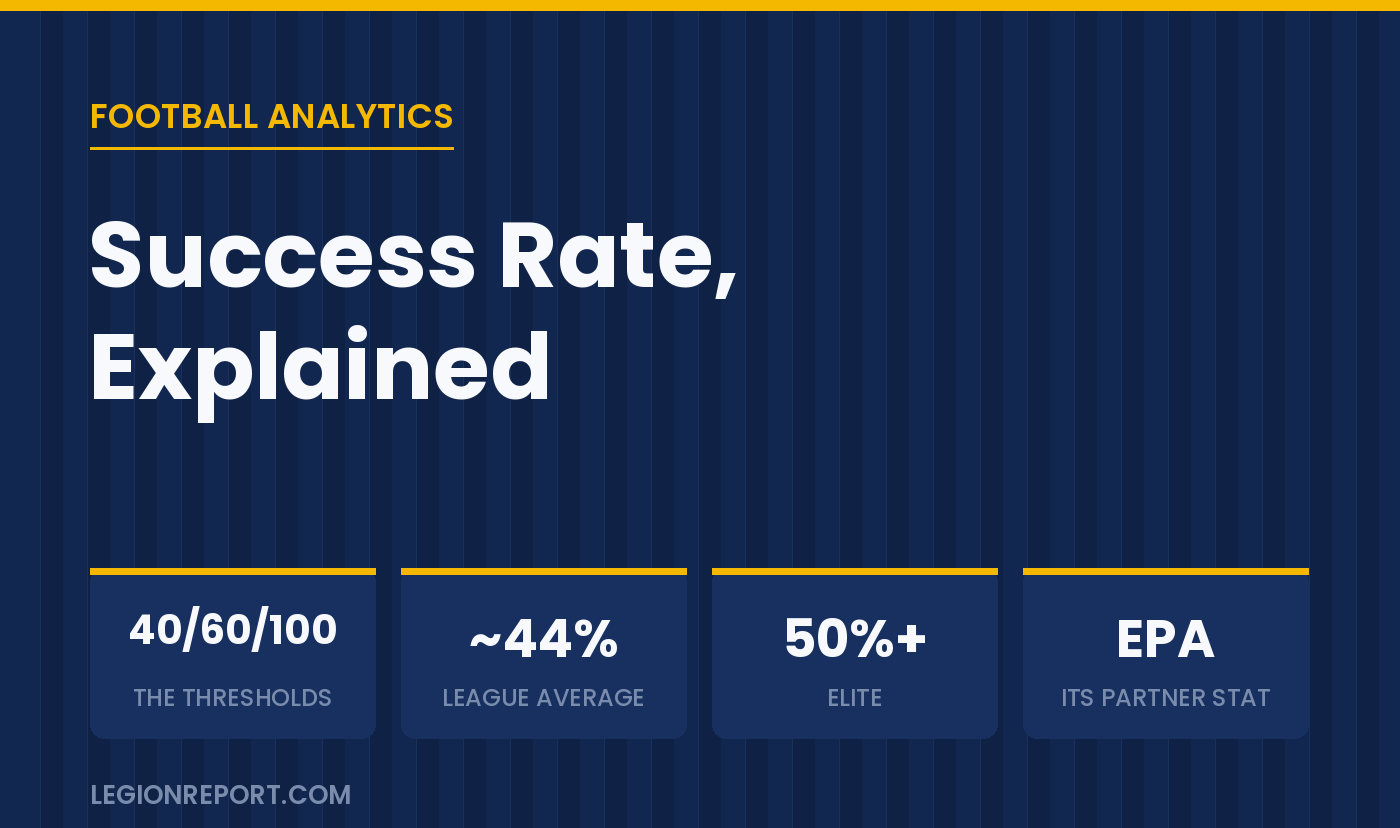

Success rate is football analytics’ answer to a simple question EPA can’t cleanly answer: how consistent is this offense? EPA per play can be dragged around by a handful of explosive gains; success rate ignores magnitude entirely and just asks, on every snap, did the play keep the offense on schedule? It’s the sport’s best measure of down-to-down reliability — the difference between an offense that lives in third-and-3 and one that lives in third-and-9.
The standard definition sets a yardage bar by down: a play is a “success” if it gains at least 40% of the yards to go on first down, 60% on second down, and 100% on third or fourth down. On first-and-10, four yards is a success; on second-and-6, four yards is a success; on third-and-4, only the conversion counts. League-average offenses succeed on roughly 43-45% of plays; elite units push past 50%.
The chart below covers the definition, the benchmarks, and how success rate pairs with EPA to describe an offense’s personality. Take a look, then we’ll get into why the combination matters more than either number alone.
Why Analysts Read Success Rate and EPA Together
Each stat covers the other’s blind spot. EPA per play captures magnitude — the explosive plays that actually win games — but a few of them can disguise an offense failing on most downs. Success rate captures reliability but treats a 4-yard gain and a 40-yard touchdown identically. Together they describe an offense’s personality in two numbers: the four-quadrant table above is the standard shorthand, and the ‘machine’ quadrant (high success, high EPA) is where champions come from. The same pairing works for defenses, run games, individual backs, and receivers — consistency plus impact, measured separately.
The Bottom Line
Success rate marks every play as on-schedule or not — 40% of the distance on first down, 60% on second, conversion on third and fourth — and averages the results into the sport’s cleanest consistency measure. League average sits in the mid-40s, elite offenses clear 50%, and the stat’s real power comes from pairing it with EPA to separate sustainable offenses from boom-or-bust ones. For the value side of that pairing, see our guide to Expected Points Added, and for the quarterback-accuracy piece, CPOE explained.